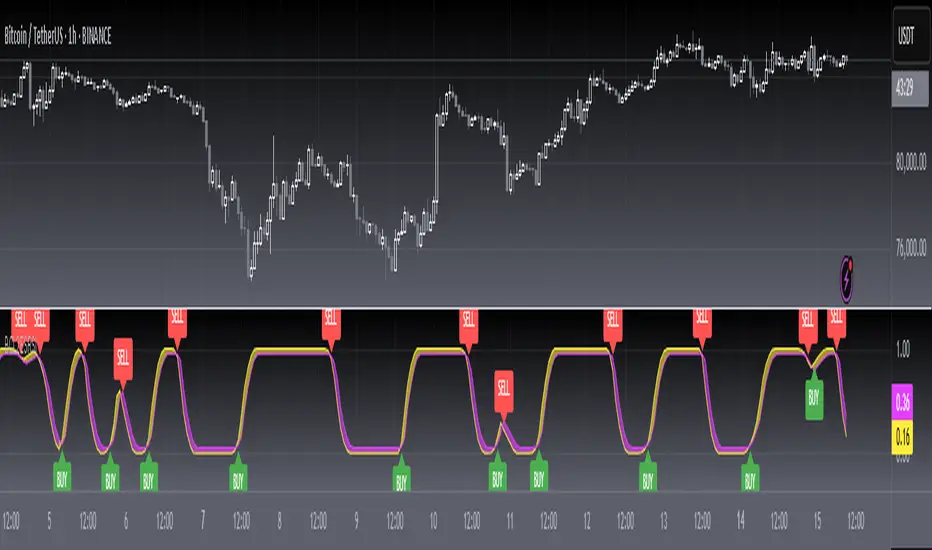
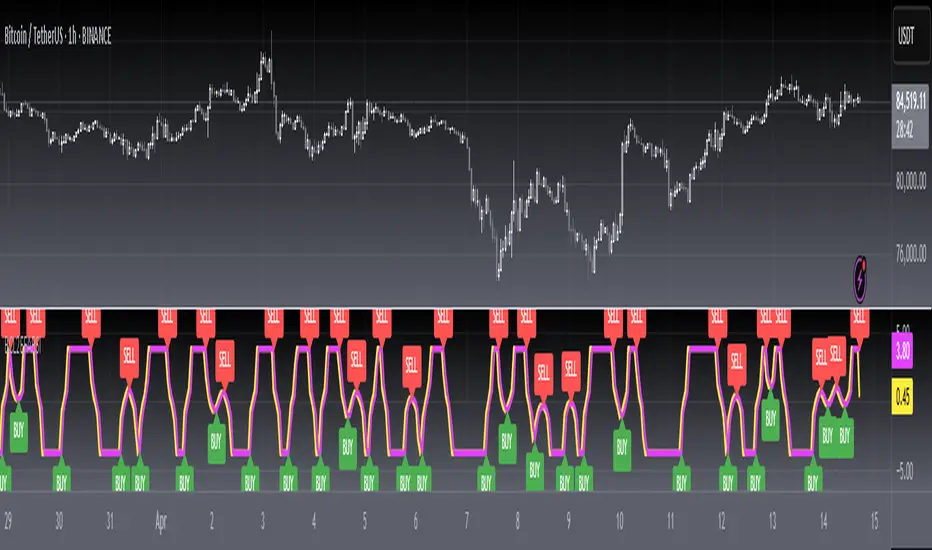
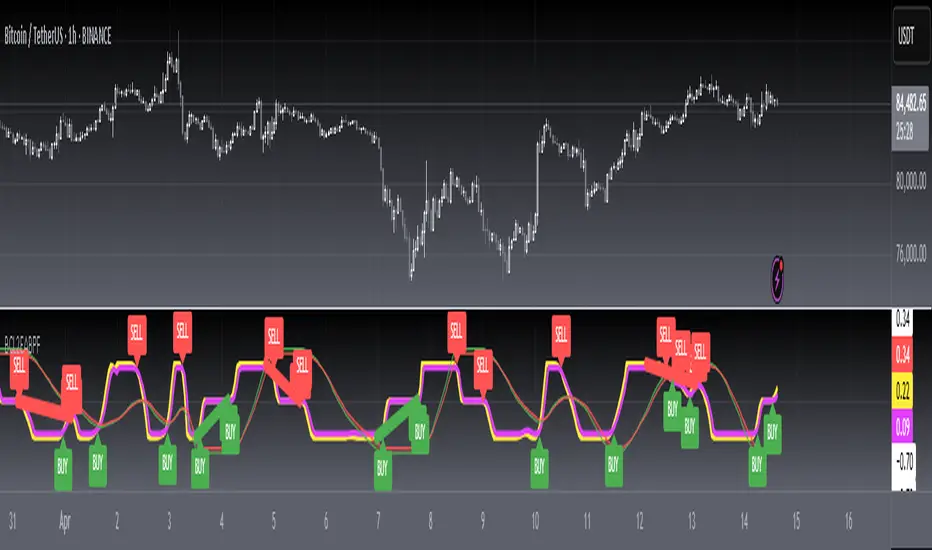
[blackcat] L2 Ehlers Stochastic RSILevel: 2
Background
John F. Ehlers introuced his Stochastic RSI in August, 2006.
Function
John Ehlers' article in August, 2006, "Modeling The Market = Building Trading Strategies," describes a process for extracting trend and cyclic elements from market data, then recombining them for trading purposes. He used the Stochastic RSI denoted the cyclic elements.
Key Signal
StochRSI--> Ehlers Stochastic RSI fast line
Trigger--> Ehlers Stochastic RSI slow line
Pros and Cons
100% John F. Ehlers definition translation, even variable names are the same. This help readers who would like to use pine to read his book.
Remarks
The 70th script for Blackcat1402 John F. Ehlers Week publication.
Readme
In real life, I am a prolific inventor. I have successfully applied for more than 60 international and regional patents in the past 12 years. But in the past two years or so, I have tried to transfer my creativity to the development of trading strategies. Tradingview is the ideal platform for me. I am selecting and contributing some of the hundreds of scripts to publish in Tradingview community. Welcome everyone to interact with me to discuss these interesting pine scripts.
The scripts posted are categorized into 5 levels according to my efforts or manhours put into these works.
Level 1 : interesting script snippets or distinctive improvement from classic indicators or strategy. Level 1 scripts can usually appear in more complex indicators as a function module or element.
Level 2 : composite indicator/strategy. By selecting or combining several independent or dependent functions or sub indicators in proper way, the composite script exhibits a resonance phenomenon which can filter out noise or fake trading signal to enhance trading confidence level.
Level 3 : comprehensive indicator/strategy. They are simple trading systems based on my strategies. They are commonly containing several or all of entry signal, close signal, stop loss, take profit, re-entry, risk management, and position sizing techniques. Even some interesting fundamental and mass psychological aspects are incorporated.
Level 4 : script snippets or functions that do not disclose source code. Interesting element that can reveal market laws and work as raw material for indicators and strategies. If you find Level 1~2 scripts are helpful, Level 4 is a private version that took me far more efforts to develop.
Level 5 : indicator/strategy that do not disclose source code. private version of Level 3 script with my accumulated script processing skills or a large number of custom functions. I had a private function library built in past two years. Level 5 scripts use many of them to achieve private trading strategy.
Cerca negli script per "THE SCRIPT"
[blackcat] L2 Ehlers Zero-lag SmootherLevel: 2
Background
John F. Ehlers introuced Zero-Lag Data Smoothers in Jul, 2002.
Function
John Ehlers introduced "Zero-Lag Data Smoothers", the infinite impulse response (IIR) filter and finite impulse response (FIR) filter.
In his article this issue on zero-lag smoothing, John Ehlers notes that his favorite filter is the symmetrically weighted six-bar finite impulse response (FIR) filter. This is also known as a triangular moving average, and can be conveniently implemented as a double-smoothed simple moving average. Per Ehlers, since this filter has six elements, its lag is 2.5 bars. Via further processing, this lag can be reduced to zero, but this produces too much overshoot. As a compromise, Ehlers suggests reducing the lag to one bar. To enable a user to adjust the lag easily, I provide the pine v4 code for an Adjustable Lag Filter indicator below. The first input, Price, should typically be set to OHLC, hl2, hl3, ohlc4 etc. The second input, LagReduction, should be set to a value in the zero-to-2.5 range. Setting it to zero will result in no adjustment, and the output will match that of the raw triangular average. Setting it to 2.5 will reduce the lag to zero. Setting it to 1.5 will reduce the lag to one bar.
Key Signal
Filter--> Zero-Lag Data Smoother fast line
Trigger--> Zero-Lag Data Smoother slow line
Pros and Cons
100% John F. Ehlers definition translation, even variable names are the same. This help readers who would like to use pine to read his book.
Remarks
The 67th script for Blackcat1402 John F. Ehlers Week publication.
Readme
In real life, I am a prolific inventor. I have successfully applied for more than 60 international and regional patents in the past 12 years. But in the past two years or so, I have tried to transfer my creativity to the development of trading strategies. Tradingview is the ideal platform for me. I am selecting and contributing some of the hundreds of scripts to publish in Tradingview community. Welcome everyone to interact with me to discuss these interesting pine scripts.
The scripts posted are categorized into 5 levels according to my efforts or manhours put into these works.
Level 1 : interesting script snippets or distinctive improvement from classic indicators or strategy. Level 1 scripts can usually appear in more complex indicators as a function module or element.
Level 2 : composite indicator/strategy. By selecting or combining several independent or dependent functions or sub indicators in proper way, the composite script exhibits a resonance phenomenon which can filter out noise or fake trading signal to enhance trading confidence level.
Level 3 : comprehensive indicator/strategy. They are simple trading systems based on my strategies. They are commonly containing several or all of entry signal, close signal, stop loss, take profit, re-entry, risk management, and position sizing techniques. Even some interesting fundamental and mass psychological aspects are incorporated.
Level 4 : script snippets or functions that do not disclose source code. Interesting element that can reveal market laws and work as raw material for indicators and strategies. If you find Level 1~2 scripts are helpful, Level 4 is a private version that took me far more efforts to develop.
Level 5 : indicator/strategy that do not disclose source code. private version of Level 3 script with my accumulated script processing skills or a large number of custom functions. I had a private function library built in past two years. Level 5 scripts use many of them to achieve private trading strategy.
[blackcat] L2 Ehlers Hilbert Channel Breakout Trading SystemLevel: 2
Background
John F. Ehlers introuced Hilbert Channel Breakout Trading System in Nov, 2000.
Function
This indicator will show how the adaptive filter is being applied to a trading strategy. After the Hilbert Channel Breakout Signal is optimized, set the inputs for this indicator to match the corresponding inputs for the signal.
In the March 2000 STOCKS & COMMODITIES, John Ehlers published a algorithm for the Hilbert cycle period, an indicator that plots the length of the current market cycle. The Hilbert transform achieved computational efficiency by using a two-dimensional numbering system. Unfortunately, this introduces amplitude error in calculating the quadrature component. Dr. Ehlers compensated for this error. He have updated the method of compensating for the amplitude error by applying a straight-line compensation term using the frequency calculation from one bar ago. This is possible because the cycle period cannot change drastically from bar to bar. The slowly varying cycle period is adequate to do a good job of amplitude compensation.
In addition, Dr. Ehlers have used a different way to compute the cycle period. He used a homodyne discriminator because it exhibits superior performance in a low signal-to-noise environment. Homodyne means he used the signal multiplied by itself one bar ago to produce a zero-frequency beat note. This beat note carries the phase angle of the one-bar change. Still using the basic definition of a cycle, the one-bar rate of change of phase is exactly the cycle period.
Here is the pine v4 code to generate the signals in the Hilbert channel breakout trading system, as discussed in Dr. Ehlers article in this issue, "Optimizing With Hilbert Indicators." The signal itself is a simple channel breakout system that generates buy and exit signals, that shows whether the system is long or flat; the high of the bar and the value of the entry channel; and the low of the bar and the value of the exit channel. This helps you see on a bar-by-bar basis exactly how the system is behaving.
Key Signal
longcond--> when high breakouts EntryChannel to long
shortcond--> when low breakouts ExitChannel to short
Pros and Cons
100% John F. Ehlers definition translation, even variable names are the same. This help readers who would like to use pine to read his book.
Remarks
The 66th script for Blackcat1402 John F. Ehlers Week publication.
I tested it and believe it work better in small time frame e.g. 15m than large time frames.
Readme
In real life, I am a prolific inventor. I have successfully applied for more than 60 international and regional patents in the past 12 years. But in the past two years or so, I have tried to transfer my creativity to the development of trading strategies. Tradingview is the ideal platform for me. I am selecting and contributing some of the hundreds of scripts to publish in Tradingview community. Welcome everyone to interact with me to discuss these interesting pine scripts.
The scripts posted are categorized into 5 levels according to my efforts or manhours put into these works.
Level 1 : interesting script snippets or distinctive improvement from classic indicators or strategy. Level 1 scripts can usually appear in more complex indicators as a function module or element.
Level 2 : composite indicator/strategy. By selecting or combining several independent or dependent functions or sub indicators in proper way, the composite script exhibits a resonance phenomenon which can filter out noise or fake trading signal to enhance trading confidence level.
Level 3 : comprehensive indicator/strategy. They are simple trading systems based on my strategies. They are commonly containing several or all of entry signal, close signal, stop loss, take profit, re-entry, risk management, and position sizing techniques. Even some interesting fundamental and mass psychological aspects are incorporated.
Level 4 : script snippets or functions that do not disclose source code. Interesting element that can reveal market laws and work as raw material for indicators and strategies. If you find Level 1~2 scripts are helpful, Level 4 is a private version that took me far more efforts to develop.
Level 5 : indicator/strategy that do not disclose source code. private version of Level 3 script with my accumulated script processing skills or a large number of custom functions. I had a private function library built in past two years. Level 5 scripts use many of them to achieve private trading strategy.

[blackcat] L2 Ehlers Squelch IndicatorLevel: 2
Background
John F. Ehlers introuced the squelch indicator in Sep, 2000.
Function
This the squelch indicator code is identical to the Hilbert period code , with the addition of the squelch threshold and the display being implemented as a paintbar -- that is, a bar on the chart being colored, depending on the squelch threshold value.
The Pine v4 code for displaying the squelch control as a paintbar for John Ehlers's article, "Squelch Those Whipsaws," can be reproduced in Tradingview by breaking the steps into separate functions. For example, functions can be written to calculate the "InPhase" and "Quadrature" variables, which can then be used in the calculation of the "Phase," "DeltaPhase," and "InstPeriod."
Although paintbars are not a feature of Tradingview, a similar effect can be displayed in a chart by writing a function to determine whether the period is less than 20. This function can then be displayed in main chart to highlight whether the price is in a trend mode or a cycle mode. The squelch period should also prove useful as an input for neural network predictions.
Key Signal
Plot1--> Highlight Period smaller than Squelch Threshold
Plot2--> Highlight Period smaller than Squelch Threshold
Pros and Cons
100% John F. Ehlers definition translation, even variable names are the same. This help readers who would like to use pine to read his book.
Remarks
The 65th script for Blackcat1402 John F. Ehlers Week publication.
Readme
In real life, I am a prolific inventor. I have successfully applied for more than 60 international and regional patents in the past 12 years. But in the past two years or so, I have tried to transfer my creativity to the development of trading strategies. Tradingview is the ideal platform for me. I am selecting and contributing some of the hundreds of scripts to publish in Tradingview community. Welcome everyone to interact with me to discuss these interesting pine scripts.
The scripts posted are categorized into 5 levels according to my efforts or manhours put into these works.
Level 1 : interesting script snippets or distinctive improvement from classic indicators or strategy. Level 1 scripts can usually appear in more complex indicators as a function module or element.
Level 2 : composite indicator/strategy. By selecting or combining several independent or dependent functions or sub indicators in proper way, the composite script exhibits a resonance phenomenon which can filter out noise or fake trading signal to enhance trading confidence level.
Level 3 : comprehensive indicator/strategy. They are simple trading systems based on my strategies. They are commonly containing several or all of entry signal, close signal, stop loss, take profit, re-entry, risk management, and position sizing techniques. Even some interesting fundamental and mass psychological aspects are incorporated.
Level 4 : script snippets or functions that do not disclose source code. Interesting element that can reveal market laws and work as raw material for indicators and strategies. If you find Level 1~2 scripts are helpful, Level 4 is a private version that took me far more efforts to develop.
Level 5 : indicator/strategy that do not disclose source code. private version of Level 3 script with my accumulated script processing skills or a large number of custom functions. I had a private function library built in past two years. Level 5 scripts use many of them to achieve private trading strategy.

[blackcat] L2 Ehlers Swiss Army KnifeLevel: 2
Background
John F. Ehlers introuced swiss army knife (SAK)indicator in 2005.
Function
The swiss army knife (SAK)indicator does all the common functions of the usual indicators, such as smoothing and momentum generation. It also does some unusual things, such as band stop and band reject filtering. Once you program this indicator into your trading platform you can do virtually any technical analysis technique with it. This unique general indicator results from general Digital Signal Processing (DSP) concepts for discrete signal networks that appear in various forms in technical analysis .
The description of this indicator involves Z Transforms. Z Transforms are a convenient way of solving difficult difference equations in much the same way as LaPlace Transforms are used to solve differential equations in calculus. Difference equations arise from the use of sampled data, such as we have in technical analysis . That is, daily bars sample price data once a day. Intraday bars sample price data every minute, hour, or whatever. The concept is the same regardless of the sampling rate. In Z Transforms, Z^(-1) stands for one sample period of delay. For simplicity, I will always refer to daily bars as the sample rate.
It includes,
1. Exponential Moving Average ( EMA )
2. Simple Moving Average ( SMA )
3. Two Pole Gaussian Filter
4. Two Pole Butterworth Filter
5. High Pass Filter
6. Two Pole High Pass Filter
7. BandPass Filter
8.BandStop Filter
The Swiss Army Knife Indicator is a versatile approach that creates a wide variety of responses that range from smoothers to oscillators. Novel BandPass and BandStop filters can also be produced. All of this can be done with one line of code in most platforms. The various responses come from the coefficients that can be called – as functions if you prefer.
Key Signal
Filt --> swiss army knife (SAK)indicator fast line
Trigger --> swiss army knife (SAK)indicator slow line
Pros and Cons
100% John F. Ehlers definition translation, even variable names are the same. This help readers who would like to use pine to read his book.
Remarks
The 64th script for Blackcat1402 John F. Ehlers Week publication.
Readme
In real life, I am a prolific inventor. I have successfully applied for more than 60 international and regional patents in the past 12 years. But in the past two years or so, I have tried to transfer my creativity to the development of trading strategies. Tradingview is the ideal platform for me. I am selecting and contributing some of the hundreds of scripts to publish in Tradingview community. Welcome everyone to interact with me to discuss these interesting pine scripts.
The scripts posted are categorized into 5 levels according to my efforts or manhours put into these works.
Level 1 : interesting script snippets or distinctive improvement from classic indicators or strategy. Level 1 scripts can usually appear in more complex indicators as a function module or element.
Level 2 : composite indicator/strategy. By selecting or combining several independent or dependent functions or sub indicators in proper way, the composite script exhibits a resonance phenomenon which can filter out noise or fake trading signal to enhance trading confidence level.
Level 3 : comprehensive indicator/strategy. They are simple trading systems based on my strategies. They are commonly containing several or all of entry signal, close signal, stop loss, take profit, re-entry, risk management, and position sizing techniques. Even some interesting fundamental and mass psychological aspects are incorporated.
Level 4 : script snippets or functions that do not disclose source code. Interesting element that can reveal market laws and work as raw material for indicators and strategies. If you find Level 1~2 scripts are helpful, Level 4 is a private version that took me far more efforts to develop.
Level 5 : indicator/strategy that do not disclose source code. private version of Level 3 script with my accumulated script processing skills or a large number of custom functions. I had a private function library built in past two years. Level 5 scripts use many of them to achieve private trading strategy.
[blackcat] L2 Ehlers FRAMALevel: 2
Background
John F. Ehlers introuced Fractal Adaptive Moving Average (FRAMA) in 2004.
Function
The objective of using filters is to separate the desired signals from the undesired signals (or noise). The practical application of moving averages often involves a tradeoff between the amount of smoothness required and the amount of lag that can be tolerated. Moving averages have this problem because the price data is not stationary, and may have different bandwidths over different time intervals. Various momentum-adaptive filtering techniques have been developed to take advantage of the nonstationary structure of prices. Adaptive filters have also been developed based on price statistics and the cyclic content of the price data . Dr. Ehlers described a different class of filters that monitor a different measure of temporal nonstationarity and alters their bandwidth in response to this measure.
There is no argument that market prices are fractal. Fractal shapes are self-similar because they tend to have the same roughness and sparseness regardless of the magnification used to view them. If you remove the labels from a 5 minute chart, a daily chart, and a weekly chart you would have difficulty telling them apart. This is the characteristic that makes them fractal. The self-similarity can be defined by the fractal dimension that describes the sparseness at all magnification levels.
To determine the fractal dimension of a generalized pattern, Dr. Ehlers cover the pattern with a number “N” of small objects of several various sizes “s”. As with any moving average, we are forced to compromise between responsiveness and smoothness. FRAMA can be a valuable weapon in your arsenal of technical indicators. It rapidly follows significant changes in price but becomes very flat in congestion zones so that bad whipsaw trades can be eliminated.
Key Signal
Filt --> FRAMA fast line
Trigger --> FRAMA slow line
Pros and Cons
100% John F. Ehlers definition translation, even variable names are the same. This help readers who would like to use pine to read his book.
Remarks
The 63th script for Blackcat1402 John F. Ehlers Week publication.
Readme
In real life, I am a prolific inventor. I have successfully applied for more than 60 international and regional patents in the past 12 years. But in the past two years or so, I have tried to transfer my creativity to the development of trading strategies. Tradingview is the ideal platform for me. I am selecting and contributing some of the hundreds of scripts to publish in Tradingview community. Welcome everyone to interact with me to discuss these interesting pine scripts.
The scripts posted are categorized into 5 levels according to my efforts or manhours put into these works.
Level 1 : interesting script snippets or distinctive improvement from classic indicators or strategy. Level 1 scripts can usually appear in more complex indicators as a function module or element.
Level 2 : composite indicator/strategy. By selecting or combining several independent or dependent functions or sub indicators in proper way, the composite script exhibits a resonance phenomenon which can filter out noise or fake trading signal to enhance trading confidence level.
Level 3 : comprehensive indicator/strategy. They are simple trading systems based on my strategies. They are commonly containing several or all of entry signal, close signal, stop loss, take profit, re-entry, risk management, and position sizing techniques. Even some interesting fundamental and mass psychological aspects are incorporated.
Level 4 : script snippets or functions that do not disclose source code. Interesting element that can reveal market laws and work as raw material for indicators and strategies. If you find Level 1~2 scripts are helpful, Level 4 is a private version that took me far more efforts to develop.
Level 5 : indicator/strategy that do not disclose source code. private version of Level 3 script with my accumulated script processing skills or a large number of custom functions. I had a private function library built in past two years. Level 5 scripts use many of them to achieve private trading strategy.

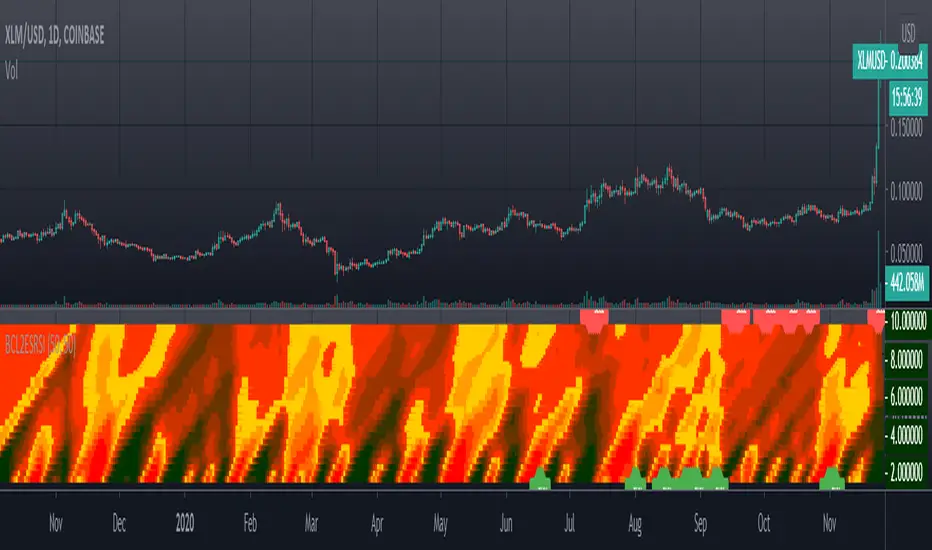
[blackcat] L2 Ehlers SwamiCharts RSILevel: 2
Background
John F. Ehlers introuced SwamiCharts RSI in his "Cycle Analytics for Traders" chapter 16 on 2013.
Function
SwamiCharts retain the core functionality of the technical indicators with which you're already familiar, while packing much more information into an easy-to interpret heat map chart. With SwamiCharts, you now visualize each indicator over a range of lookback periods
to reveal a better view of the indicator's truer meaning in context. SwamiCharts provide a better solution because you can now visualize context over a wide range of lookback periods. Trends and cycles emerge more succinctly, while continuation patterns and reversals become
easier to identify. SwamiCharts solves the data lookback problem by enabling you to view market conditions at a glance, a feature that will dramatically facilitate your trading.
Since the MyRSI is computed for all values over the range of lookback periods, it must be an array in Pine v4.0 rather than a variable. The RSI is computed relative to the output of the roofing filter rather than price closes to eliminate the effects of Spectral Dilation. After the computation of the ratio, the indicator is smoothed in a SuperSmoother filter, so we must create the three most recent instances ourselves in the code. This is because Pine v4.0 retains historical values for variables but not for arrays. In fact, ratio must be an array also for the same reasons. The coefficients for the 10-bar SuperSmoother filter are computed and are the same for all lookback periods, and so can be outside the lookback loop to make the calculations a little more efficient.
Key Signal
MyRSI1 --> Modified RSI by John Ehlers
Pros and Cons
100% John F. Ehlers definition translation, even variable names are the same. This help readers who would like to use pine to read his book.
Remarks
The 62th script for Blackcat1402 John F. Ehlers Week publication.
Readme
In real life, I am a prolific inventor. I have successfully applied for more than 60 international and regional patents in the past 12 years. But in the past two years or so, I have tried to transfer my creativity to the development of trading strategies. Tradingview is the ideal platform for me. I am selecting and contributing some of the hundreds of scripts to publish in Tradingview community. Welcome everyone to interact with me to discuss these interesting pine scripts.
The scripts posted are categorized into 5 levels according to my efforts or manhours put into these works.
Level 1 : interesting script snippets or distinctive improvement from classic indicators or strategy. Level 1 scripts can usually appear in more complex indicators as a function module or element.
Level 2 : composite indicator/strategy. By selecting or combining several independent or dependent functions or sub indicators in proper way, the composite script exhibits a resonance phenomenon which can filter out noise or fake trading signal to enhance trading confidence level.
Level 3 : comprehensive indicator/strategy. They are simple trading systems based on my strategies. They are commonly containing several or all of entry signal, close signal, stop loss, take profit, re-entry, risk management, and position sizing techniques. Even some interesting fundamental and mass psychological aspects are incorporated.
Level 4 : script snippets or functions that do not disclose source code. Interesting element that can reveal market laws and work as raw material for indicators and strategies. If you find Level 1~2 scripts are helpful, Level 4 is a private version that took me far more efforts to develop.
Level 5 : indicator/strategy that do not disclose source code. private version of Level 3 script with my accumulated script processing skills or a large number of custom functions. I had a private function library built in past two years. Level 5 scripts use many of them to achieve private trading strategy.
[blackcat] L2 Ehlers Fisher Adaptive RSILevel: 2
Background
John F. Ehlers introuced adding the Fisher Transform to the Adaptive RSI in his "Cycle Analytics for Traders" chapter 15 on 2013.
Function
The purpose of the Fisher transform is to take any indicator having a nominally zero mean and bounded between the limits of −1 to +1 and convert the amplitude so that the transformed indicator has an approximate normal probability distribution. The variable MyRSI ranges between zero and one, and therefore to accommodate the conditions for the Fisher transform, this variable must be translated and dilated to range between −1 and +1. If the MyRSI variable does not range fully between zero and one, you can shorten the RSI lookback period to be less than half the measured dominant cycle, or you can simply multiply it by a magnification factor as Dr. Ehlers have done in the code fragment. The amplifying factor was selected to make the indicator rarely exceed the two sigma points in the output. The amplified RSI is then limited to be within the range of −0.999 to +0.999 to avoid a computer crash, and then is used to compute the Fisher transform. The plus and minus two standard deviation levels are included in the indicator display.
Key Signal
Fish --> Fisher Adaptive RSI fast line
Trigger --> Fisher Adaptive RSI slow line
Pros and Cons
100% John F. Ehlers definition translation, even variable names are the same. This help readers who would like to use pine to read his book.
Remarks
The 61th script for Blackcat1402 John F. Ehlers Week publication.
Readme
In real life, I am a prolific inventor. I have successfully applied for more than 60 international and regional patents in the past 12 years. But in the past two years or so, I have tried to transfer my creativity to the development of trading strategies. Tradingview is the ideal platform for me. I am selecting and contributing some of the hundreds of scripts to publish in Tradingview community. Welcome everyone to interact with me to discuss these interesting pine scripts.
The scripts posted are categorized into 5 levels according to my efforts or manhours put into these works.
Level 1 : interesting script snippets or distinctive improvement from classic indicators or strategy. Level 1 scripts can usually appear in more complex indicators as a function module or element.
Level 2 : composite indicator/strategy. By selecting or combining several independent or dependent functions or sub indicators in proper way, the composite script exhibits a resonance phenomenon which can filter out noise or fake trading signal to enhance trading confidence level.
Level 3 : comprehensive indicator/strategy. They are simple trading systems based on my strategies. They are commonly containing several or all of entry signal, close signal, stop loss, take profit, re-entry, risk management, and position sizing techniques. Even some interesting fundamental and mass psychological aspects are incorporated.
Level 4 : script snippets or functions that do not disclose source code. Interesting element that can reveal market laws and work as raw material for indicators and strategies. If you find Level 1~2 scripts are helpful, Level 4 is a private version that took me far more efforts to develop.
Level 5 : indicator/strategy that do not disclose source code. private version of Level 3 script with my accumulated script processing skills or a large number of custom functions. I had a private function library built in past two years. Level 5 scripts use many of them to achieve private trading strategy.
[blackcat] L2 Ehlers DC using the HomoDyne DiscriminatorLevel: 2
Background
John F. Ehlers introuced Measuring the Dominant Cycle using the HomoDyne Discriminator in his "Cycle Analytics for Traders" chapter 14 on 2013.
Function
With Hilbert transformer, the third algorithm for computing the dominant cycle is the homodyne approach. Homodyne means the signal is multiplied by itself. More precisely, we want to multiply the signal of the current bar with the complex value of the signal one bar ago. The complex conjugate is, by definition, a complex number whose sign of the imaginary component has been reversed.
Key Signal
DomCycle --> Dominant Cycle
Pros and Cons
100% John F. Ehlers definition translation, even variable names are the same. This help readers who would like to use pine to read his book.
Remarks
The 61th script for Blackcat1402 John F. Ehlers Week publication.
Readme
In real life, I am a prolific inventor. I have successfully applied for more than 60 international and regional patents in the past 12 years. But in the past two years or so, I have tried to transfer my creativity to the development of trading strategies. Tradingview is the ideal platform for me. I am selecting and contributing some of the hundreds of scripts to publish in Tradingview community. Welcome everyone to interact with me to discuss these interesting pine scripts.
The scripts posted are categorized into 5 levels according to my efforts or manhours put into these works.
Level 1 : interesting script snippets or distinctive improvement from classic indicators or strategy. Level 1 scripts can usually appear in more complex indicators as a function module or element.
Level 2 : composite indicator/strategy. By selecting or combining several independent or dependent functions or sub indicators in proper way, the composite script exhibits a resonance phenomenon which can filter out noise or fake trading signal to enhance trading confidence level.
Level 3 : comprehensive indicator/strategy. They are simple trading systems based on my strategies. They are commonly containing several or all of entry signal, close signal, stop loss, take profit, re-entry, risk management, and position sizing techniques. Even some interesting fundamental and mass psychological aspects are incorporated.
Level 4 : script snippets or functions that do not disclose source code. Interesting element that can reveal market laws and work as raw material for indicators and strategies. If you find Level 1~2 scripts are helpful, Level 4 is a private version that took me far more efforts to develop.
Level 5 : indicator/strategy that do not disclose source code. private version of Level 3 script with my accumulated script processing skills or a large number of custom functions. I had a private function library built in past two years. Level 5 scripts use many of them to achieve private trading strategy.

[blackcat] L2 Ehlers DC using the Phase AccumulationLevel: 2
Background
John F. Ehlers introuced Measuring the Dominant Cycle using the Phase Accumulation in his "Cycle Analytics for Traders" chapter 14 on 2013.
Function
With Hilbert transformer, the next algorithm to compute the dominant cycle is the phase accumulation method. The phase accumulation method of computing the dominant cycle is perhaps the easiest to comprehend. In this technique, we measure the phase at each sample by taking the arctangent of the ratio of the quadrature component to the in-phase component. A delta phase is generated by taking the difference of the phase between successive samples. At each sample we can then look backwards, adding up the delta phases. When the sum of the delta phases reaches 360 degrees, we must have passed through one full cycle, on average. The process is repeated for each new sample.
The phase accumulation method of cycle measurement always uses one full cycle's worth of historical data. This is both an advantage and a disadvantage. The advantage is the lag in obtaining the answer scales directly with the cycle period. That is, the measurement of a short cycle period has less lag than the measurement of a longer cycle period. However, the number of samples used in making the measurement means the averaging period is variable with cycle period. Longer averaging reduces the noise level compared to the signal. Therefore, shorter cycle periods necessarily have a higher output signal-to-noise ratio.
Key Signal
DomCycle --> Dominant Cycle
Pros and Cons
100% John F. Ehlers definition translation, even variable names are the same. This help readers who would like to use pine to read his book.
Remarks
The 60th script for Blackcat1402 John F. Ehlers Week publication.
Readme
In real life, I am a prolific inventor. I have successfully applied for more than 60 international and regional patents in the past 12 years. But in the past two years or so, I have tried to transfer my creativity to the development of trading strategies. Tradingview is the ideal platform for me. I am selecting and contributing some of the hundreds of scripts to publish in Tradingview community. Welcome everyone to interact with me to discuss these interesting pine scripts.
The scripts posted are categorized into 5 levels according to my efforts or manhours put into these works.
Level 1 : interesting script snippets or distinctive improvement from classic indicators or strategy. Level 1 scripts can usually appear in more complex indicators as a function module or element.
Level 2 : composite indicator/strategy. By selecting or combining several independent or dependent functions or sub indicators in proper way, the composite script exhibits a resonance phenomenon which can filter out noise or fake trading signal to enhance trading confidence level.
Level 3 : comprehensive indicator/strategy. They are simple trading systems based on my strategies. They are commonly containing several or all of entry signal, close signal, stop loss, take profit, re-entry, risk management, and position sizing techniques. Even some interesting fundamental and mass psychological aspects are incorporated.
Level 4 : script snippets or functions that do not disclose source code. Interesting element that can reveal market laws and work as raw material for indicators and strategies. If you find Level 1~2 scripts are helpful, Level 4 is a private version that took me far more efforts to develop.
Level 5 : indicator/strategy that do not disclose source code. private version of Level 3 script with my accumulated script processing skills or a large number of custom functions. I had a private function library built in past two years. Level 5 scripts use many of them to achieve private trading strategy.
[blackcat] L2 Ehlers DC using the Dual DifferentiatorLevel: 2
Background
John F. Ehlers introuced Measuring the Dominant Cycle using the Dual Differentiator in his "Cycle Analytics for Traders" chapter 14 on 2013.
Function
With Hilbert transformer, the first algorithm to compute the dominant cycle is called the dual differentiator. In this case, the phase angle is computed from the analytic signal as the arctangent of the ratio of the imaginary component to the real component. Further, the angular frequency is defined as the rate change of phase. We can use these facts to derive the cycle period.
Key Signal
DomCycle --> Dominant Cycle
Pros and Cons
100% John F. Ehlers definition translation, even variable names are the same. This help readers who would like to use pine to read his book.
Remarks
The 59th script for Blackcat1402 John F. Ehlers Week publication.
Readme
In real life, I am a prolific inventor. I have successfully applied for more than 60 international and regional patents in the past 12 years. But in the past two years or so, I have tried to transfer my creativity to the development of trading strategies. Tradingview is the ideal platform for me. I am selecting and contributing some of the hundreds of scripts to publish in Tradingview community. Welcome everyone to interact with me to discuss these interesting pine scripts.
The scripts posted are categorized into 5 levels according to my efforts or manhours put into these works.
Level 1 : interesting script snippets or distinctive improvement from classic indicators or strategy. Level 1 scripts can usually appear in more complex indicators as a function module or element.
Level 2 : composite indicator/strategy. By selecting or combining several independent or dependent functions or sub indicators in proper way, the composite script exhibits a resonance phenomenon which can filter out noise or fake trading signal to enhance trading confidence level.
Level 3 : comprehensive indicator/strategy. They are simple trading systems based on my strategies. They are commonly containing several or all of entry signal, close signal, stop loss, take profit, re-entry, risk management, and position sizing techniques. Even some interesting fundamental and mass psychological aspects are incorporated.
Level 4 : script snippets or functions that do not disclose source code. Interesting element that can reveal market laws and work as raw material for indicators and strategies. If you find Level 1~2 scripts are helpful, Level 4 is a private version that took me far more efforts to develop.
Level 5 : indicator/strategy that do not disclose source code. private version of Level 3 script with my accumulated script processing skills or a large number of custom functions. I had a private function library built in past two years. Level 5 scripts use many of them to achieve private trading strategy.

[blackcat] L2 Ehlers Hilbert Transformer IndicatorLevel: 2
Background
John F. Ehlers introuced Hilbert Transformer Indicator in his "Cycle Analytics for Traders" chapter 14 on 2013.
Function
Basically, the real component moves with the general direction of the prices, and the imaginary component is a predictive indicator for the real component in the same sense that a cosine wave is a predictor of a sine wave. Although the default LPPeriod input is set to 20 bars in an attempt to smooth the indicator the imaginary component is still too erratic to be useful.
Key Signal
Imag --> Quadrature phase output signal
Real --> In-phase output signal
Pros and Cons
100% John F. Ehlers definition translation, even variable names are the same. This help readers who would like to use pine to read his book.
Remarks
The 58th script for Blackcat1402 John F. Ehlers Week publication.
Readme
In real life, I am a prolific inventor. I have successfully applied for more than 60 international and regional patents in the past 12 years. But in the past two years or so, I have tried to transfer my creativity to the development of trading strategies. Tradingview is the ideal platform for me. I am selecting and contributing some of the hundreds of scripts to publish in Tradingview community. Welcome everyone to interact with me to discuss these interesting pine scripts.
The scripts posted are categorized into 5 levels according to my efforts or manhours put into these works.
Level 1 : interesting script snippets or distinctive improvement from classic indicators or strategy. Level 1 scripts can usually appear in more complex indicators as a function module or element.
Level 2 : composite indicator/strategy. By selecting or combining several independent or dependent functions or sub indicators in proper way, the composite script exhibits a resonance phenomenon which can filter out noise or fake trading signal to enhance trading confidence level.
Level 3 : comprehensive indicator/strategy. They are simple trading systems based on my strategies. They are commonly containing several or all of entry signal, close signal, stop loss, take profit, re-entry, risk management, and position sizing techniques. Even some interesting fundamental and mass psychological aspects are incorporated.
Level 4 : script snippets or functions that do not disclose source code. Interesting element that can reveal market laws and work as raw material for indicators and strategies. If you find Level 1~2 scripts are helpful, Level 4 is a private version that took me far more efforts to develop.
Level 5 : indicator/strategy that do not disclose source code. private version of Level 3 script with my accumulated script processing skills or a large number of custom functions. I had a private function library built in past two years. Level 5 scripts use many of them to achieve private trading strategy.
[blackcat] L2 Ehlers Classic Hilbert TransformerLevel: 2
Background
John F. Ehlers introuced Classic Hilbert Transform in his "Cycle Analytics for Traders" chapter 14 on 2013. The Hilbert Transform is a procedure to create complex signals from the simple chart data familiar to all traders. Once we have the complex signals, we can compute indicators and signals that are more accurate and responsive than those computed using conventional techniques. In fact, some of the indicators we will discuss cannot be calculated at all without the Hilbert Transform.
Function
blackcat L2 Ehlers Hilbert Transform indicator performs basic Hilbert Transform ( HT ) from chart data source and generate complex IQ data.
Key Signal
Imag --> Quadrature phase output signal
Real --> In-phase output signal
Pros and Cons
100% John F. Ehlers definition translation, even variable names are the same. This help readers who would like to use pine to read his book.
Remarks
The 57th script for Blackcat1402 John F. Ehlers Week publication.
Readme
In real life, I am a prolific inventor. I have successfully applied for more than 60 international and regional patents in the past 12 years. But in the past two years or so, I have tried to transfer my creativity to the development of trading strategies. Tradingview is the ideal platform for me. I am selecting and contributing some of the hundreds of scripts to publish in Tradingview community. Welcome everyone to interact with me to discuss these interesting pine scripts.
The scripts posted are categorized into 5 levels according to my efforts or manhours put into these works.
Level 1 : interesting script snippets or distinctive improvement from classic indicators or strategy. Level 1 scripts can usually appear in more complex indicators as a function module or element.
Level 2 : composite indicator/strategy. By selecting or combining several independent or dependent functions or sub indicators in proper way, the composite script exhibits a resonance phenomenon which can filter out noise or fake trading signal to enhance trading confidence level.
Level 3 : comprehensive indicator/strategy. They are simple trading systems based on my strategies. They are commonly containing several or all of entry signal, close signal, stop loss, take profit, re-entry, risk management, and position sizing techniques. Even some interesting fundamental and mass psychological aspects are incorporated.
Level 4 : script snippets or functions that do not disclose source code. Interesting element that can reveal market laws and work as raw material for indicators and strategies. If you find Level 1~2 scripts are helpful, Level 4 is a private version that took me far more efforts to develop.
Level 5 : indicator/strategy that do not disclose source code. private version of Level 3 script with my accumulated script processing skills or a large number of custom functions. I had a private function library built in past two years. Level 5 scripts use many of them to achieve private trading strategy.

[blackcat] L2 Ehlers Convolution IndicatorLevel: 2
Background
John F. Ehlers introduced Convolution Indicator in his "Cycle Analytics for Traders" chapter 13 on 2013.
Function
Since high correlation exists only at the market turning point, the convolution indicator is dependent on the lookback period used in the calculation. Assuming the two price segments have an equal time duration, the peak correlation occurs at half the lookback period of the indicator. For example, if a 13-bar period is used, the market peak would appear with a 7-bar delay. The same market peak would appear with a 19-bar delay if a 39-bar lookback period were used in the convolution computation.
Key Signal
Convolution --> Convolution array
Pros and Cons
100% John F. Ehlers definition translation of original work, even variable names are the same. This help readers who would like to use pine to read his book. If you had read his works, then you will be quite familiar with my code style.
Remarks
The 56th script for Blackcat1402 John F. Ehlers Week publication.
Courtesy of @RicardoSantos for RGB functions.
Readme
In real life, I am a prolific inventor. I have successfully applied for more than 60 international and regional patents in the past 12 years. But in the past two years or so, I have tried to transfer my creativity to the development of trading strategies. Tradingview is the ideal platform for me. I am selecting and contributing some of the hundreds of scripts to publish in Tradingview community. Welcome everyone to interact with me to discuss these interesting pine scripts.
The scripts posted are categorized into 5 levels according to my efforts or manhours put into these works.
Level 1 : interesting script snippets or distinctive improvement from classic indicators or strategy. Level 1 scripts can usually appear in more complex indicators as a function module or element.
Level 2 : composite indicator/strategy. By selecting or combining several independent or dependent functions or sub indicators in proper way, the composite script exhibits a resonance phenomenon which can filter out noise or fake trading signal to enhance trading confidence level.
Level 3 : comprehensive indicator/strategy. They are simple trading systems based on my strategies. They are commonly containing several or all of entry signal, close signal, stop loss, take profit, re-entry, risk management, and position sizing techniques. Even some interesting fundamental and mass psychological aspects are incorporated.
Level 4 : script snippets or functions that do not disclose source code. Interesting element that can reveal market laws and work as raw material for indicators and strategies. If you find Level 1~2 scripts are helpful, Level 4 is a private version that took me far more efforts to develop.
Level 5 : indicator/strategy that do not disclose source code. private version of Level 3 script with my accumulated script processing skills or a large number of custom functions. I had a private function library built in past two years. Level 5 scripts use many of them to achieve private trading strategy.
[blackcat] L2 Ehlers Even Better SinwaveLevel: 2
Background
John F. Ehlers introduced Even Better sinwave Indicator in his "Cycle Analytics for Traders" chapter 12 on 2013.
Function
The original Sinewave Indicator was created by seeking the dominant cycle phase angle that had the best correlation between the price data and a theoretical dominant cycle sine wave. The Even Better Sinewave Indicator skips all the cycle measurements completely and relies on a strong normalization of the waveform at the output of a modified roofing filter. The modified roofing filter uses a single-pole high-pass filter to deliberately retain the longer-period trend components. The single-pole high-pass filter basically levels the amplitude of all the cycle components that would otherwise be larger with longer wavelengths due to Spectral Dilation. Therefore, when the waveform is normalized to the power in the waveform over a short period of time, the longer wavelength contributions tend to be an indication to stay in a trade when the market is in a trend.
The Even Better Sinewave Indicator works extraordinarily well when the market is in a trend mode. This means that the spectacular failures of most swing wave indicators are mitigated when the expected price turning point does not occur.
Although Dr. Ehlers admitted he had not studied it extensively, it appears that the Even Better Sinewave Indicator works well on futures intraday data. It takes a position in the correct direction and tends to stay with the good trades without excessive whipsawing.
Key Signal
Wave --> Even Better sinwave Indicator fast line
Trigger --> Even Better sinwave Indicator slow line
Pros and Cons
100% John F. Ehlers definition translation of original work, even variable names are the same. This help readers who would like to use pine to read his book. If you had read his works, then you will be quite familiar with my code style.
Remarks
The 55th script for Blackcat1402 John F. Ehlers Week publication.
Readme
In real life, I am a prolific inventor. I have successfully applied for more than 60 international and regional patents in the past 12 years. But in the past two years or so, I have tried to transfer my creativity to the development of trading strategies. Tradingview is the ideal platform for me. I am selecting and contributing some of the hundreds of scripts to publish in Tradingview community. Welcome everyone to interact with me to discuss these interesting pine scripts.
The scripts posted are categorized into 5 levels according to my efforts or manhours put into these works.
Level 1 : interesting script snippets or distinctive improvement from classic indicators or strategy. Level 1 scripts can usually appear in more complex indicators as a function module or element.
Level 2 : composite indicator/strategy. By selecting or combining several independent or dependent functions or sub indicators in proper way, the composite script exhibits a resonance phenomenon which can filter out noise or fake trading signal to enhance trading confidence level.
Level 3 : comprehensive indicator/strategy. They are simple trading systems based on my strategies. They are commonly containing several or all of entry signal, close signal, stop loss, take profit, re-entry, risk management, and position sizing techniques. Even some interesting fundamental and mass psychological aspects are incorporated.
Level 4 : script snippets or functions that do not disclose source code. Interesting element that can reveal market laws and work as raw material for indicators and strategies. If you find Level 1~2 scripts are helpful, Level 4 is a private version that took me far more efforts to develop.
Level 5 : indicator/strategy that do not disclose source code. private version of Level 3 script with my accumulated script processing skills or a large number of custom functions. I had a private function library built in past two years. Level 5 scripts use many of them to achieve private trading strategy.

[blackcat] L2 Ehlers Adaptive BandPass FilterLevel: 2
Background
John F. Ehlers introduced Adaptive BandPass Filter in his "Cycle Analytics for Traders" chapter 11 on 2013.
Function
Adaptive band-pass filter was designed. It just makes since to tune that filter to the measured dominant cycle to eliminate all the other frequency components that are of no interest. Here, the adaptive band-pass indicator starts with the computation of the dominant cycle using the autocorrelation periodogram approach.
One way to make a band-pass filter have a leading phase capability is to tune the filter to a period shorter than the period of the cycle being measured. In this case, the bandwidth of filter is set to 0.3. That is 30 percent of the tuned center period. Therefore, the half bandwidth is 15 percent. We tune the filter to be 10 percent toward the shorter period from the dominant cycle period to provide the phase lead while still having the data of interest be within the filter bandwidth. This provides a phase lead of the dominant cycle to be something on the order of 60 degrees, or one-sixth of a cycle. If the dominant cycle were 18 bars, for example, then the detuning of the filter would produce a 3-bar lead. This leading function is not huge, but it is significant.
A convenient trigger line is included in the adaptive band-pass filter to signal the more highly likely buy and sell points. The trigger is compute as 90 percent of the amplitude of the adaptive band-pass filter line and is delayed by one bar. While the line crossings occur after the peak of the band-pass filter, phase lead provides for the generation of a timely signal. Significant trading signals should also include the criteria that the line crossing occur at greater than the +0.7 and less than the −0.7 reference lines.
Key Signal
DominantCycle --> Dominant Cycle signal
Signal --> Adaptive BandPass Filter signal
Trigger --> lag version of Adaptive BandPass Filter sinal
LeadSignal --> Adaptive BandPass Filter Lead signal
Trigger2 --> lag version of Adaptive BandPass Filter Lead sinal
Pros and Cons
100% John F. Ehlers definition translation of original work, even variable names are the same. This help readers who would like to use pine to read his book. If you had read his works, then you will be quite familiar with my code style.
Remarks
The 54th script for Blackcat1402 John F. Ehlers Week publication.
Readme
In real life, I am a prolific inventor. I have successfully applied for more than 60 international and regional patents in the past 12 years. But in the past two years or so, I have tried to transfer my creativity to the development of trading strategies. Tradingview is the ideal platform for me. I am selecting and contributing some of the hundreds of scripts to publish in Tradingview community. Welcome everyone to interact with me to discuss these interesting pine scripts.
The scripts posted are categorized into 5 levels according to my efforts or manhours put into these works.
Level 1 : interesting script snippets or distinctive improvement from classic indicators or strategy. Level 1 scripts can usually appear in more complex indicators as a function module or element.
Level 2 : composite indicator/strategy. By selecting or combining several independent or dependent functions or sub indicators in proper way, the composite script exhibits a resonance phenomenon which can filter out noise or fake trading signal to enhance trading confidence level.
Level 3 : comprehensive indicator/strategy. They are simple trading systems based on my strategies. They are commonly containing several or all of entry signal, close signal, stop loss, take profit, re-entry, risk management, and position sizing techniques. Even some interesting fundamental and mass psychological aspects are incorporated.
Level 4 : script snippets or functions that do not disclose source code. Interesting element that can reveal market laws and work as raw material for indicators and strategies. If you find Level 1~2 scripts are helpful, Level 4 is a private version that took me far more efforts to develop.
Level 5 : indicator/strategy that do not disclose source code. private version of Level 3 script with my accumulated script processing skills or a large number of custom functions. I had a private function library built in past two years. Level 5 scripts use many of them to achieve private trading strategy.
[blackcat] L2 Ehlers Adaptive CCI 2013Level: 2
Background
John F. Ehlers introduced Adaptive CCI 2013 in his "Cycle Analytics for Traders" chapter 11 on 2013.
Function
The time length to be used for the channel in the calculations is widely varied in the literature. In all cases, the length is rather arbitrarily established to fit the indicator to some preconceived event. It seems to me that it would be better to use one full period of the dominant cycle as the length of data to be used.
The adaptive CCI indicator starts with the computation of the dominant cycle using the autocorrelation periodogram approach. The identification of the indicator itself is noted by the comment near the end following the dominant cycle calculation. Since the objective is to use only those frequency components passed by the roofing filter, the variable Filt is used as a data input rather than the average of the high, low, and close as was done by Donald Lambert (Inventor of CCI).
Key Signal
DominantCycle --> Dominant Cycle signal
MyCCI --> Adaptive CCI signal
Trigger --> lag version of Adaptive CCI signal
Pros and Cons
100% John F. Ehlers definition translation of original work, even variable names are the same. This help readers who would like to use pine to read his book. If you had read his works, then you will be quite familiar with my code style.
Remarks
The 53th script for Blackcat1402 John F. Ehlers Week publication.
Readme
In real life, I am a prolific inventor. I have successfully applied for more than 60 international and regional patents in the past 12 years. But in the past two years or so, I have tried to transfer my creativity to the development of trading strategies. Tradingview is the ideal platform for me. I am selecting and contributing some of the hundreds of scripts to publish in Tradingview community. Welcome everyone to interact with me to discuss these interesting pine scripts.
The scripts posted are categorized into 5 levels according to my efforts or manhours put into these works.
Level 1 : interesting script snippets or distinctive improvement from classic indicators or strategy. Level 1 scripts can usually appear in more complex indicators as a function module or element.
Level 2 : composite indicator/strategy. By selecting or combining several independent or dependent functions or sub indicators in proper way, the composite script exhibits a resonance phenomenon which can filter out noise or fake trading signal to enhance trading confidence level.
Level 3 : comprehensive indicator/strategy. They are simple trading systems based on my strategies. They are commonly containing several or all of entry signal, close signal, stop loss, take profit, re-entry, risk management, and position sizing techniques. Even some interesting fundamental and mass psychological aspects are incorporated.
Level 4 : script snippets or functions that do not disclose source code. Interesting element that can reveal market laws and work as raw material for indicators and strategies. If you find Level 1~2 scripts are helpful, Level 4 is a private version that took me far more efforts to develop.
Level 5 : indicator/strategy that do not disclose source code. private version of Level 3 script with my accumulated script processing skills or a large number of custom functions. I had a private function library built in past two years. Level 5 scripts use many of them to achieve private trading strategy.
[blackcat] L2 Ehlers Adaptive RSI 2013Level: 2
Background
John F. Ehlers introduced Adaptive RSI 2013 in his "Cycle Analytics for Traders" chapter 11 on 2013.
Function
The adaptive RSI starts with the computation of the dominant cycle using the autocorrelation periodogram approach. The identification of the RSI indicator itself following the dominant cycle calculation is noted by the comment near the end. Since the objective is to use only those frequency components passed by the roofing filter, the variable Filt is used as a data input rather than closing prices. Rather than independently taking the averages of the numerator and denominator, Dr. Ehlers chose to perform smoothing on the ratio using the SuperSmoother filter. The coefficients for the SuperSmoother filters have previously been computed in the dominant cycle measurement part of the code.
Key Signal
DominantCycle --> Dominant Cycle signal
MyRSI --> Adaptive RSI signal
Trigger --> lag version of Adaptive RSI signal
Pros and Cons
100% John F. Ehlers definition translation of original work, even variable names are the same. This help readers who would like to use pine to read his book. If you had read his works, then you will be quite familiar with my code style.
Remarks
The 52th script for Blackcat1402 John F. Ehlers Week publication.
Courtesy of @RicardoSantos for RGB functions.
Readme
In real life, I am a prolific inventor. I have successfully applied for more than 60 international and regional patents in the past 12 years. But in the past two years or so, I have tried to transfer my creativity to the development of trading strategies. Tradingview is the ideal platform for me. I am selecting and contributing some of the hundreds of scripts to publish in Tradingview community. Welcome everyone to interact with me to discuss these interesting pine scripts.
The scripts posted are categorized into 5 levels according to my efforts or manhours put into these works.
Level 1 : interesting script snippets or distinctive improvement from classic indicators or strategy. Level 1 scripts can usually appear in more complex indicators as a function module or element.
Level 2 : composite indicator/strategy. By selecting or combining several independent or dependent functions or sub indicators in proper way, the composite script exhibits a resonance phenomenon which can filter out noise or fake trading signal to enhance trading confidence level.
Level 3 : comprehensive indicator/strategy. They are simple trading systems based on my strategies. They are commonly containing several or all of entry signal, close signal, stop loss, take profit, re-entry, risk management, and position sizing techniques. Even some interesting fundamental and mass psychological aspects are incorporated.
Level 4 : script snippets or functions that do not disclose source code. Interesting element that can reveal market laws and work as raw material for indicators and strategies. If you find Level 1~2 scripts are helpful, Level 4 is a private version that took me far more efforts to develop.
Level 5 : indicator/strategy that do not disclose source code. private version of Level 3 script with my accumulated script processing skills or a large number of custom functions. I had a private function library built in past two years. Level 5 scripts use many of them to achieve private trading strategy.

[blackcat] L2 Ehlers DFT Spectral EstimateLevel: 2
Background
John F. Ehlers introduced DFT Spectral Estimate in his "Cycle Analytics for Traders" chapter 9 on 2013.
Function
The DFT is accomplished by correlating the data with the cosine and sine of each period of interest over the selected window period. The sum of the squares of each of these correlated values represents the relative power at each period. The only user input is whether to select Spectral Dilation compensation. The default selection is NOT to use the compensation.
The spectrum values vary between 0 and 1 after being normalized. These values are converted to colors. When the spectrum is greater than 0.5 the colors combine red and yellow, with yellow being the result when spectrum = 1 and red being the result when the spectrum = 0.5. When the spectrum is less than 0.5, the red saturation is decreased, with the result that the color is black when spectrum = 0.
Key Signal
DominantCycle --> Dominant Cycle signal
Pros and Cons
100% John F. Ehlers definition translation of original work, even variable names are the same. This help readers who would like to use pine to read his book. If you had read his works, then you will be quite familiar with my code style.
Remarks
The 51th script for Blackcat1402 John F. Ehlers Week publication.
Readme
In real life, I am a prolific inventor. I have successfully applied for more than 60 international and regional patents in the past 12 years. But in the past two years or so, I have tried to transfer my creativity to the development of trading strategies. Tradingview is the ideal platform for me. I am selecting and contributing some of the hundreds of scripts to publish in Tradingview community. Welcome everyone to interact with me to discuss these interesting pine scripts.
The scripts posted are categorized into 5 levels according to my efforts or manhours put into these works.
Level 1 : interesting script snippets or distinctive improvement from classic indicators or strategy. Level 1 scripts can usually appear in more complex indicators as a function module or element.
Level 2 : composite indicator/strategy. By selecting or combining several independent or dependent functions or sub indicators in proper way, the composite script exhibits a resonance phenomenon which can filter out noise or fake trading signal to enhance trading confidence level.
Level 3 : comprehensive indicator/strategy. They are simple trading systems based on my strategies. They are commonly containing several or all of entry signal, close signal, stop loss, take profit, re-entry, risk management, and position sizing techniques. Even some interesting fundamental and mass psychological aspects are incorporated.
Level 4 : script snippets or functions that do not disclose source code. Interesting element that can reveal market laws and work as raw material for indicators and strategies. If you find Level 1~2 scripts are helpful, Level 4 is a private version that took me far more efforts to develop.
Level 5 : indicator/strategy that do not disclose source code. private version of Level 3 script with my accumulated script processing skills or a large number of custom functions. I had a private function library built in past two years. Level 5 scripts use many of them to achieve private trading strategy.

[blackcat] L2 Ehlers Autocorrelation ReversalsLevel: 2
Background
John F. Ehlers introduced Autocorrelation Reversals in his "Cycle Analytics for Traders" chapter 8 on 2013.
Function
One of the distinctive characteristics of autocorrelation is that the autocorrelation shifts from yelow to red or from red to yellow at all values of lag at the cyclic reversals of the price. Therefore, all we need do to determine these reversals is to sum the bar-to-bar differences of the autocorrelation function across all values of lag. When the sum is large a turning point has been identified.
The indicated reversals are very sensitive to the smoothing of the price data. Therefore, the LPLength is made available as an indicator input to decrease or increase the number of indicated reversals as desired. The AvgLength parameter is also made available as an indicator because this averaging also impacts the number of indicated reversals. Care should be taken when increasing the value of this input because the lag of the indicator increases in direct proportion to the increase of the value of the AvgLength. Typical delay of the indicator will be about three bars when the AvgLength parameter is set to a value of 3. The HPLength parameter is also made available as an input for complete flexibility of the indicator. However, changing its value has a relatively minor impact on the indicated reversals.
Key Signal
Reversals --> Autocorrelation Reversals pulses
Pros and Cons
100% John F. Ehlers definition translation of original work, even variable names are the same. This help readers who would like to use pine to read his book. If you had read his works, then you will be quite familiar with my code style.
Remarks
The 50th script for Blackcat1402 John F. Ehlers Week publication.
Readme
In real life, I am a prolific inventor. I have successfully applied for more than 60 international and regional patents in the past 12 years. But in the past two years or so, I have tried to transfer my creativity to the development of trading strategies. Tradingview is the ideal platform for me. I am selecting and contributing some of the hundreds of scripts to publish in Tradingview community. Welcome everyone to interact with me to discuss these interesting pine scripts.
The scripts posted are categorized into 5 levels according to my efforts or manhours put into these works.
Level 1 : interesting script snippets or distinctive improvement from classic indicators or strategy. Level 1 scripts can usually appear in more complex indicators as a function module or element.
Level 2 : composite indicator/strategy. By selecting or combining several independent or dependent functions or sub indicators in proper way, the composite script exhibits a resonance phenomenon which can filter out noise or fake trading signal to enhance trading confidence level.
Level 3 : comprehensive indicator/strategy. They are simple trading systems based on my strategies. They are commonly containing several or all of entry signal, close signal, stop loss, take profit, re-entry, risk management, and position sizing techniques. Even some interesting fundamental and mass psychological aspects are incorporated.
Level 4 : script snippets or functions that do not disclose source code. Interesting element that can reveal market laws and work as raw material for indicators and strategies. If you find Level 1~2 scripts are helpful, Level 4 is a private version that took me far more efforts to develop.
Level 5 : indicator/strategy that do not disclose source code. private version of Level 3 script with my accumulated script processing skills or a large number of custom functions. I had a private function library built in past two years. Level 5 scripts use many of them to achieve private trading strategy.
[blackcat] L2 Ehlers Autocorrelation PeriodogramLevel: 2
Background
John F. Ehlers introduced Autocorrelation Periodogram in his "Cycle Analytics for Traders" chapter 8 on 2013.
Function
Construction of the autocorrelation periodogram starts with the autocorrelation function using the minimum three bars of averaging. The cyclic information is extracted using a discrete Fourier transform (DFT) of the autocorrelation results. This approach has at least four distinct advantages over other spectral estimation techniques. These are:
1. Rapid response. The spectral estimates start to form within a half-cycle period of their initiation.
2. Relative cyclic power as a function of time is estimated. The autocorrelation at all cycle periods can be low if there are no cycles present, for example, during a trend. Previous works treated the maximum cycle amplitude at each time bar equally.
3. The autocorrelation is constrained to be between minus one and plus one regardless of the period of the measured cycle period. This obviates the need to compensate for Spectral Dilation of the cycle amplitude as a function of the cycle period.
4. The resolution of the cyclic measurement is inherently high and is independent of any windowing function of the price data.
The dominant cycle is extracted from the spectral estimate in the next block of code using a center-of-gravity (CG) algorithm. The CG algorithm measures the average center of two-dimensional objects. The algorithm computes the average period at which the powers are centered. That is the dominant cycle. The dominant cycle is a value that varies with time. The spectrum values vary between 0 and 1 after being normalized. These values are converted to colors. When the spectrum is greater than 0.5, the colors combine red and yellow, with yellow being the result when spectrum = 1 and red being the result when the spectrum = 0.5. When the spectrum is less than 0.5, the red saturation is decreased, with the result the color is black when spectrum = 0.
Key Signal
DominantCycle --> Dominant Cycle
Period --> Autocorrelation Periodogram Array
Pros and Cons
100% John F. Ehlers definition translation of original work, even variable names are the same. This help readers who would like to use pine to read his book. If you had read his works, then you will be quite familiar with my code style.
Remarks
The 49th script for Blackcat1402 John F. Ehlers Week publication.
Courtesy of @RicardoSantos for RGB functions.
Readme
In real life, I am a prolific inventor. I have successfully applied for more than 60 international and regional patents in the past 12 years. But in the past two years or so, I have tried to transfer my creativity to the development of trading strategies. Tradingview is the ideal platform for me. I am selecting and contributing some of the hundreds of scripts to publish in Tradingview community. Welcome everyone to interact with me to discuss these interesting pine scripts.
The scripts posted are categorized into 5 levels according to my efforts or manhours put into these works.
Level 1 : interesting script snippets or distinctive improvement from classic indicators or strategy. Level 1 scripts can usually appear in more complex indicators as a function module or element.
Level 2 : composite indicator/strategy. By selecting or combining several independent or dependent functions or sub indicators in proper way, the composite script exhibits a resonance phenomenon which can filter out noise or fake trading signal to enhance trading confidence level.
Level 3 : comprehensive indicator/strategy. They are simple trading systems based on my strategies. They are commonly containing several or all of entry signal, close signal, stop loss, take profit, re-entry, risk management, and position sizing techniques. Even some interesting fundamental and mass psychological aspects are incorporated.
Level 4 : script snippets or functions that do not disclose source code. Interesting element that can reveal market laws and work as raw material for indicators and strategies. If you find Level 1~2 scripts are helpful, Level 4 is a private version that took me far more efforts to develop.
Level 5 : indicator/strategy that do not disclose source code. private version of Level 3 script with my accumulated script processing skills or a large number of custom functions. I had a private function library built in past two years. Level 5 scripts use many of them to achieve private trading strategy.

[blackcat] L2 Ehlers Modified RSI IndicatorLevel: 2
Background
John F. Ehlers introuced Modified RSI Indicator in his "Cycle Analytics for Traders" chapter 7 on 2013.
Function
The RSI is the percentage of the sum of the delta closes up to the sum of all the delta closes over the observation period. The only variable here is the observation period. To have maximum effectiveness the observation period should be half of the measured period. If the observation period is half the dominant cycle, then for a pure sine wave, the closes up is exactly equal to the total closes during part of the cycle from the valley to the peak. In this case, the RSI would have a value of 100. During another part of the cycle—the next half cycle—there would be no closes up. During this half cycle, the RSI would have a value of zero. So, in principle, half the measured cycle is the correct choice for the RSI observation period.
A modified RSI that is a standard RSI preceded by a SuperSmoother filter. The modified RSI is far more responsive and has less lag because the low frequency components have have been removed by the high-pass part of the SuperSmoother filter. The RSI is functionally the same as a single-pole high-pass filter because the CU term in the numerator is just a summation of one-bar differences.
Key Signal
MyRSI --> Modified RSI Indicator fast line
Trigger --> Modified RSI Indicator slow line
Pros and Cons
100% John F. Ehlers definition translation of original work, even variable names are the same. This help readers who would like to use pine to read his book. If you had read his works, then you will be quite familiar with my code style.
Remarks
The 45th script for Blackcat1402 John F. Ehlers Week publication.
Readme
In real life, I am a prolific inventor. I have successfully applied for more than 60 international and regional patents in the past 12 years. But in the past two years or so, I have tried to transfer my creativity to the development of trading strategies. Tradingview is the ideal platform for me. I am selecting and contributing some of the hundreds of scripts to publish in Tradingview community. Welcome everyone to interact with me to discuss these interesting pine scripts.
The scripts posted are categorized into 5 levels according to my efforts or manhours put into these works.
Level 1 : interesting script snippets or distinctive improvement from classic indicators or strategy. Level 1 scripts can usually appear in more complex indicators as a function module or element.
Level 2 : composite indicator/strategy. By selecting or combining several independent or dependent functions or sub indicators in proper way, the composite script exhibits a resonance phenomenon which can filter out noise or fake trading signal to enhance trading confidence level.
Level 3 : comprehensive indicator/strategy. They are simple trading systems based on my strategies. They are commonly containing several or all of entry signal, close signal, stop loss, take profit, re-entry, risk management, and position sizing techniques. Even some interesting fundamental and mass psychological aspects are incorporated.
Level 4 : script snippets or functions that do not disclose source code. Interesting element that can reveal market laws and work as raw material for indicators and strategies. If you find Level 1~2 scripts are helpful, Level 4 is a private version that took me far more efforts to develop.
Level 5 : indicator/strategy that do not disclose source code. private version of Level 3 script with my accumulated script processing skills or a large number of custom functions. I had a private function library built in past two years. Level 5 scripts use many of them to achieve private trading strategy.
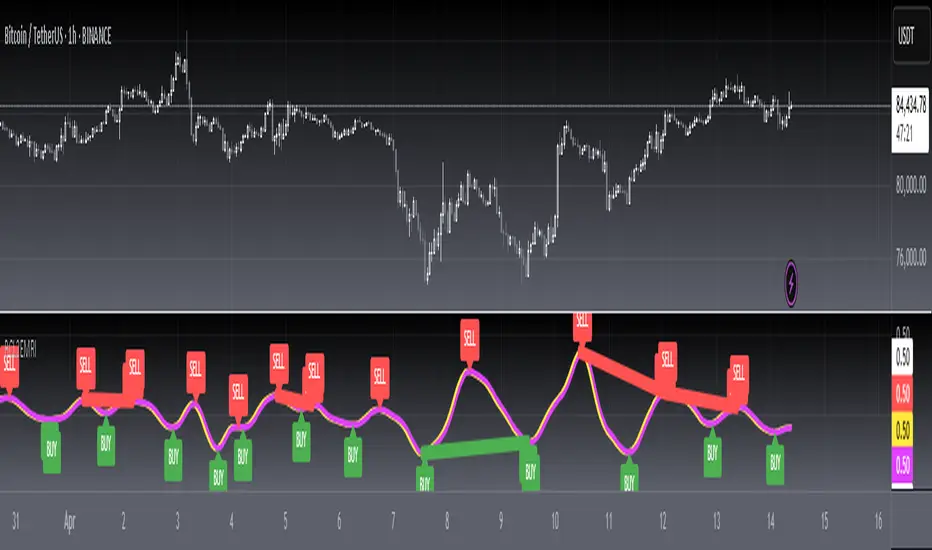
[blackcat] L2 Ehlers Modified Stochastic IndicatorLevel: 2
Background
John F. Ehlers introuced Modified Stochastic Indicator in his "Cycle Analytics for Traders" chapter 7 on 2013.
Function
Conventional indicators are not immune to the effects of spectral dilation. For example, a Stochastic indicator remains near its upper bound when the market is in an uptrend even though a relatively short lookback period is used. This, of course, is due to the presence of the larger and longer cyclic components in the data. In a broad sense, the classic Stochastic indicator acts as a one-pole filter because there is just a single difference term in the numerator of its calculation. This calculation is the same as the standard, except Dr. Ehlers use a SuperSmoother for the smoothing instead of moving averages. The bottom subgraph shows an identical calculation except that the Stochastic calculations are preceded by the roofing filter that constrains the cyclic components to fall within the range from 10-bar to 48-bar periods. Clearly, the Stochastic indicator has been dramatically altered by the insertion of the roofing filter.
Dr. Ehlers leaves it to the reader to explore how standard indicators can be improved simply by inserting the roofing filter before the indicator computations are begun.
Key Signal
MyStochastic --> Modified Stochastic Indicator fast line
Trigger --> Modified Stochastic Indicator slow line
Pros and Cons
100% John F. Ehlers definition translation of original work, even variable names are the same. This help readers who would like to use pine to read his book. If you had read his works, then you will be quite familiar with my code style.
Remarks
The 44th script for Blackcat1402 John F. Ehlers Week publication.
Readme
In real life, I am a prolific inventor. I have successfully applied for more than 60 international and regional patents in the past 12 years. But in the past two years or so, I have tried to transfer my creativity to the development of trading strategies. Tradingview is the ideal platform for me. I am selecting and contributing some of the hundreds of scripts to publish in Tradingview community. Welcome everyone to interact with me to discuss these interesting pine scripts.
The scripts posted are categorized into 5 levels according to my efforts or manhours put into these works.
Level 1 : interesting script snippets or distinctive improvement from classic indicators or strategy. Level 1 scripts can usually appear in more complex indicators as a function module or element.
Level 2 : composite indicator/strategy. By selecting or combining several independent or dependent functions or sub indicators in proper way, the composite script exhibits a resonance phenomenon which can filter out noise or fake trading signal to enhance trading confidence level.
Level 3 : comprehensive indicator/strategy. They are simple trading systems based on my strategies. They are commonly containing several or all of entry signal, close signal, stop loss, take profit, re-entry, risk management, and position sizing techniques. Even some interesting fundamental and mass psychological aspects are incorporated.
Level 4 : script snippets or functions that do not disclose source code. Interesting element that can reveal market laws and work as raw material for indicators and strategies. If you find Level 1~2 scripts are helpful, Level 4 is a private version that took me far more efforts to develop.
Level 5 : indicator/strategy that do not disclose source code. private version of Level 3 script with my accumulated script processing skills or a large number of custom functions. I had a private function library built in past two years. Level 5 scripts use many of them to achieve private trading strategy.
